Heat of the summer

Figure 1. Landsat-8 based estimations of LST in Vaasa area. Spring left, Summer right. Click to enlarge.
In this month’s Megamagazine article we visualized output from an algorithm that used Landsat-8 observations as the main input, results depicting estimated Land Surface Temperatures (LST). Algorithm and the code necessary for visualization was developed by by Ermida, Soares, Mantas and Trigo (2020). We run the algorithm for two dates, one in Spring (left - 26.4.2020) and one during the height of the Summer (right - 5.7.2020). These two images are presented above, in the Figure 1. As we look at the left most image, depicting the LST in Spring we see clearly the general estimated temperatures to be lower than in the right-most image, which presents the estimated temperatures in Summer. Both times, satellite crossed over the region during the morning around 10 o’clock local time, so during the day the temperatures will have risen. In both Spring and Summer visualizations it is evident, that there are variances between temperatures on the different things on the surface.
In the Figure 2, there is Sentinel-3 observation based estimation of the LST using the same color scaling for the temperatures, but with different spatial scaling. As the main input for LST algorithm of the European Space Agency (ESA) was a measurement from the Sea and Land Surface Temperature Radiometer (SLSTR) instrument of Sentinel-3A satellite. That observation was done on the same day as the Landsat-8 Summer observation, with roughly less than half hour difference in timing. The spatial resolution of that sensor is much rougher, as it is intended for the observation of larger areas, so we take the opportunity to show the estimated LST in the area around Vaasa and Seinäjoki. Sentinel-3 observation tells us the same story – land surfaces do not warm up equally and that difference is possible to observe also from space. Below we explain why does that effect happen, what are these visualizations based on and why does this matter.

Figure 2. Sentinel-3 SLSTR based estimation of the LST in Vaasa-Seinäjoki region, same date and time as Landsat-8 Summer estimation. Click to enlarge.
EM radiation, heat and observing them from space
Earth is not a closed system energy wise. Energy that we get from the Sun in the form of electromagnetic (EM) radiation is vital for most of the life in the Earth. Distribution of EM radiation according to Planck’s law is related to the temperature of the object radiating – the hotter the object, more of the radiated energy is in the shorter wavelengths. As the Sun is still very hot on the surface, approximately 5500 degrees Celsius, most of the energy contained in the solar EM radiation is concentrated on the shorter wavelengths, peaking in the wavelengths of 400nm to 700 nm. Earth’s atmosphere consists of molecules that for the most part, do not interact with EM radiation at these wavelengths. If there are no such interactions, such as water vapor concentrations in the form of clouds, it reaches the earth’s surface.
What happens on the surface, depends on the physical characteristics of the matter the EM radiation encounters. Many things can happen, but most important ones for discussing Urban Heat Islands (UHI) is that EM radiation can be partially or completely absorbed (increasing the thermal energy level of the matter encountered), it can be reflected or it can be transmitted through. The wavelengths where the most solar energy is concentrated (400 nm – 700 nm) and which pass through the Earths atmosphere generally well, we call visible light and it is easy to imagine examples of the mentioned behaviors on these wavelengths. Example of absorption is when you put something in to sunlight, that does not reflect nor allow light through, for example a brick painted black. Left there it heats up. How fast it heats up and how warm it feels depends on the exact material properties. Reflection is same what happens with mirrors, but most materials do not just reflect or absorb, they do both in varying degrees. Example of transmission in visible light wavelengths are windows. In different wavelengths, different materials are “transparent” wholly or partially for the EM radiation.
As the incoming EM radiation from Sun is absorbed even partially by a material on the surface, energy is transferred into the molecules that make up the matter. They start to vibrate more, increasing the kinetic energy. As the electrical and the magnetic fields are generated by the movement of charged particles, the thermal radiation by the matter increases. All objects that are above the absolute zero (where there is no movement of atoms) emit EM radiation. Similarly to discussed solar radiance, it depends on the temperature of the matter on which area of the spectrum the EM radiation is strongest. For most temperatures that we encounter in Earth, it is usually in the wavelengths of approximately 9000 nm – 14000 nm. EM radiation on these wavelengths is often called thermal radiation.
As different objects in the ground emit this thermal radiation, some of it travels through the atmosphere to space. Landsat-8 has an instrument, Thermal Infrared Sensor (TIRS) that measures EM radiation on two bands, 10600 nm – 11900 nm and 11 500 nm – 12 510 nm. On these wavelengths, the thermal radiation passes through the atmosphere relatively well and reaches the sensors of the satellite on the orbit. Based on the knowledge on how different levels of this measured radiation correlate with the temperatures, an estimate of the surface temperature can be calculated. As the material properties of the objects in the ground affect the emitted thermal radiation, and the atmospheric and environmental parameters such as air temperature and water vapor affect the amount of radiation arriving to the sensor in the satellite, to have accurate LST estimations requires carefully developed algorithms, calibration and knowledge of these environmental situations during the measurement. It is good to remember that the resulting pixel with an estimated temperature is an average of all the different things emitting thermal radiation within that spatial area, in Landsat-8 case everything within the 100m area.
Generation of Urban Heat Island
It is clear from all the three images in Figures 1 and 2, that the areas with the most heat coincide with the areas of highest density of human created land cover such as pavements, large buildings in great density or large continuous roofs. This is a real phenomenon named Urban Heat Island (UHI). Why the effect happens, how it can measured and how it affects environment has been attracting research interest for long time. In the following, we go through some of the basics based on the highly referred research by Rizwan, Dennis and Chunho (2008).
There are two main sources of heat entering the urban environment. One is the Sun, which was discussed above, and which heats up various surfaces and other consists of all the other sources of heat, mostly man-made such as industrial machines, power plants, heating systems, cars and similar things. As we utilize our machines to do different tasks, some heat is generated as a side product. Even air-conditioners add to the heat, even if in the immediate area they produce refreshing cooling effect. In a dense area, where a large number of people live and temperatures rise, each of the residents will have to run their cooling solutions with more power, it is possible to see how it could add to the worsening of the effect, even though it is just one small aspect of it.
In urban areas, we get more heat, as we have more dense population. We have more machines, more of everything. That does not yet explain why in these areas the temperature stays high. The human made structures – buildings, pavements and roofs – are usually not designed by considering the heat related properties of the material. Consideration is usually in other aspects such as price, structural strength, weight, ease of installation and such. Therefore, we get in urban areas large amounts of material which absorbs heat well and is good in storing the heat, releasing it and increasing temperatures after the sun goes down. Rizwan et al. (2008) consider this heat absorption and storing by urban human created structures something that is controllable, that by firstly, building in configurations which are not cramped and have high sky view to facilitate heat release by long-wave radiation and secondly, to use materials that reflect more of the light instead of absorbing it. They consider these factors important in creation of UHIs and since they are controllable, it is something that could be mitigated.
There are other factors involved. In the often highly densely-built urban areas, wind does not help with the heat transfer as much as in the more open areas. It is also thought that air pollution could be factor in increasing the UHI effect. Rizwan et al. (2008) describe the mechanism as that over dense urban areas there are generally more pollutants, some of which can work a bit similar to mirrors – as the heat is radiated from the surface below, these molecules can prevent it from escaping the area and produce something a bit similar to greenhouse effect.
Last general parameter, but definitely not the least, is the amount of vegetation and water. In urban areas, amount of open water and vegetation is much smaller than in rural areas. As you see from the figure 1, in the Vaasa area it is possible to make quite good guesses based on the LST where the water areas are, and where are the areas of vegetation. Water in general does not heat up similarly to urban building in Sun light. Most of the EM radiation encountering water is reflected, not absorbed, more so as the water is stiller. Secondly, water bodies are usually relatively large as volume is considered. Even if the water is not particularly good conductor of heat, it still takes more time for the large body to heat up as the layers of different temperature water can get mixed. As you know, you need many hotter days to make the lakes comfortably swimmable.
Vegetation produces cooling effect on several ways as described by the U.S. Environmental Agency (2008). Firstly, it produces shade that prevents various things in the shade from absorbing the direct EM radiation coming from the Sun. Secondly, evaporation where the liquid water is converted to gas in the process “consuming” heat occurs in the soil in the vicinity of vegetation and on the leaves where rain water has collected in to. Contrast with the urban areas, where the paved ground is collecting the water to different outgoing sewers. Thirdly, vegetation transpirates. In transpiration vegetation collects water from the ground and emits it through their leaves. As that water evaporates, it also “uses” the heat from the air. These second and third cases are collectively referred to as evapotranspiration. Fourth effect of vegetation, especially trees is that they reduce and block wind. The result of that might be beneficial or non-beneficial during the hotter periods, but positive during the winter in relation to energy consumption. Less direct wind to outer walls decreases heating costs.
Urban Heat Island Effects
As discussed above, many of the components in creation of UHI are linked to the amount of population, their energy consumption, the density of urban structures and how it covers the natural surface. This is depicted also on the Figure 3 below. Urbanization is an ongoing megatrend in almost all parts of the world, and the number of cities grow and the cities themselves grow larger both spatially and by the number of residents. Urbanization itself increases the general efficiency as higher densities of population in urban areas result in more users for the same services, more possibilities for specialization and in general offers various cost benefits via economies of scale. Urbanization processes have negative outcomes as well, and increased and more widespread UHI is one of these. It is natural to speculate that with increased urbanization the UHI effect will in general increase, unless it’s acknowledged and taken into account in planning.
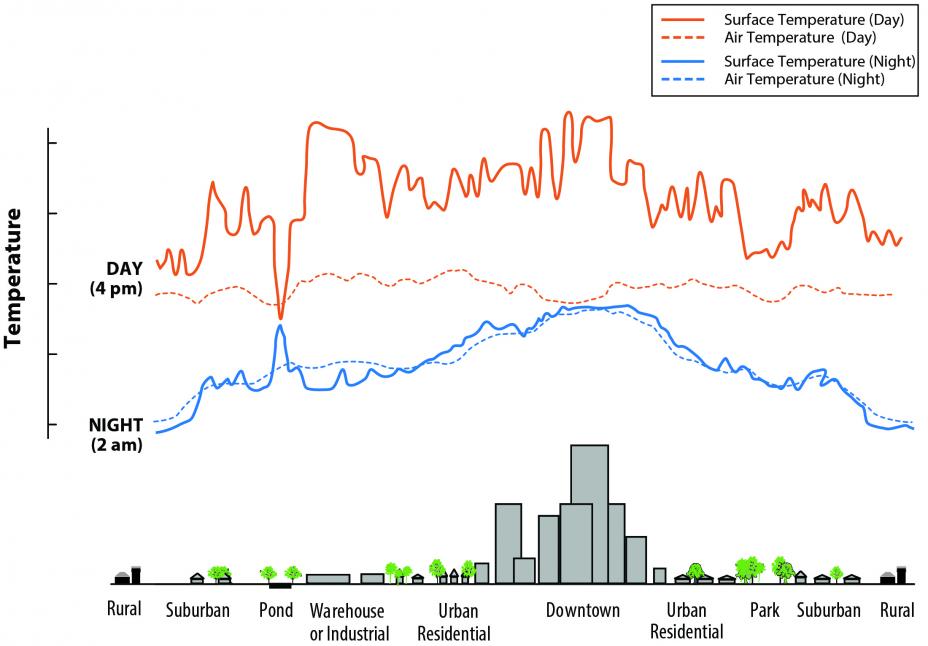
Figure 3. Temperatures over different surfaces and air. Day and night. Credit: U.S. Environmental Agency. Click to enlarge.
Why should we try to mitigate it? In general, higher temperatures are a health hazard. During heat waves it is quite common to see news about people hospitalized or worse, especially children, elders and people with existing health conditions. General heat related health problems are such as respiratory difficulties, heat cramps and exhaustion, non-fatal heat stroke and heat-related mortality. As UHIs contribute to the higher peak temperatures and increased frequency of extreme heat events, they increase the amount of such health issues. Similarly UHIs are also contributing to the higher energy consumption at such times – for example air conditioning in all forms (cars, houses). Increased energy consumption can then increase air pollution from increased electricity generation. Of course, the added heat increases the energy consumption in cooling but on the colder periods, it decreases the amount of energy required for heating. Li, Zhou, Yu, Jia, Li and Li (2019) found that the overall sum effect still requires further research to quantify and to generalize, and it is hard at this point draw global conclusions of the balance of these effects.
Phelan, Kaloush, Miner, Golden, Phelan and Silva (2015) described several other negative environmental impacts of the UHI, mainly related to air and water. UHI impact to air quality included increased amounts of smog as the temperatures rose, projected increase in ozone concentrations and a convergence zone resulting from the UHI, which can make the moving thunderstorms to pass around the city. Water quality results and mechanics they found are similar to which we discussed earlier briefly. In the rural areas and forests, the water tends to eventually either to evaporate or seep in to the ground. In a paved urban environment that is not possible. The water collects on the heated paved surfaces and is conducted to water removal sewers and eventually to the natural water systems. The water ejected can gather heat during this process and come out with higher temperature than the water in the natural environment. This increases for example algae growth disturbing the ecosystem. Additionally, the water can contain other pollutants washed from the urban surfaces.
Mitigation
Mitigation strategies for UHI effect are well known and some of those can be also deduced from the discussion we have gone through. Location of the city is something that is hardly controllable for the established urban areas, but in planning further expansion city planners can add UHI as on additional consideration amongst the many things related in such planning. Most of the sources discussed present ways to reduce the UHI effect that can be mostly grouped in two categories: 1) Increased vegetation coverage and 2) building material and geometric considerations.
As discussed, vegetation generally reduces the UHI effect in addition to other positive effect it has. Increasing the amount of open ground covered with vegetation can be simple as having larger parks or more of them, or planning new residential areas with less density and more yards, gardens or other green spaces. Both of these approaches lose some of the efficiency increase of dense urbanization. More inventive solutions would be quite literally green houses with space allocated for vegetation in outer walls or rooftops. These solutions would have other positive effects as well, unrelated to UHI.
Second category is more related to the materials used in the buildings and the geometry of structures. Using materials that reflect more of the incoming EM radiation instead of absorbing it, including painting for example pavements [for a detailed research on pavement painting performance, please see: Aletba, Hassan, Jaya, Aminudin, Mahmud, Mohamed and Hussein (2021)], and using materials with high emittance. If material has high reflectance, it reflects most of the incoming EM radiation and if high emittance, the heat it absorbs emits off quicker. Ideally, it should have both. Improvements can be gained as simply as instead of black tar roofs preferring white painted roofs, but for the best results there are available specialized cool roofing materials and paints. Urban geometry on zoning and planning level can also reduce UHI effect by increasing the mentioned sky view and by considering proper wind passages to allow heat transfer.
Other suggestions include increased open water areas, different approaches to spraying roofs for evaporation effect or concentrating in reducing the generated heat in the urban environment.
References:
Aletba, S. R. O., Hassan, N. A., Jaya, R. P., Aminudin, E., Mahmud, M. Z. H., Mohamed, A., & Hussein, A. A. (2021). Thermal performance of cooling strategies for asphalt pavement: a state-of-the-art review. Journal of Traffic and Transportation Engineering (English Edition).
Ermida, S. L., Soares, P., Mantas, V., Göttsche, F. M., & Trigo, I. F. (2020). Google earth engine open-source code for land surface temperature estimation from the landsat series. Remote Sensing, 12(9), 1471.
Li, X., Zhou, Y., Yu, S., Jia, G., Li, H., & Li, W. (2019). Urban heat island impacts on building energy consumption: A review of approaches and findings. Energy, 174, 407-419.
Phelan, P. E., Kaloush, K., Miner, M., Golden, J., Phelan, B., Silva III, H., & Taylor, R. A. (2015). Urban heat island: mechanisms, implications, and possible remedies. Annual Review of Environment and Resources, 40, 285-307.
Rizwan, A. M., Dennis, L. Y., & Chunho, L. I. U. (2008). A review on the generation, determination and mitigation of Urban Heat Island. Journal of environmental sciences, 20(1), 120-128.
U.S. Environmental Protection Agency. 2008. Reducing urban heat islands: Compendium of strategies. Draft. https://www.epa.gov/heat-islands/heat-island-compendium.