The Many Colors of the Sea

Figure 1. Kvarken Space Conversation for June. Click to enlarge.
In this month’s Megamagazine article we visualized two observations from Sentinel-2A satellite, depicting the coastal areas near Vaasa at two different dates, shown here above in Figure 1. Area is the same in both pictures, as is the season. However, these images look strikingly different to us. In this extension of the Mega-Magazine article, we’ll discuss why that is, what kind of assumptions and observations this allows and lastly, what kind of infrastructure we have in place already in Finland by Suomen Ympäristökeskus (SYKE) to deliver the information to citizens and researchers alike, utilizing these presented principles.
If you refer back to earlier Kvarken Space Conversation (link HERE), we discussed how humans see colors. Electromagnetic (EM) radiation in the wavelengths that are visible to us humans, 400 nm to 700 nm. As EM radiation on these wavelengths encounter any material, depending on the incident angle, exact wavelength and on the material, it can be either reflected, transmitted, absorbed or be scattered. Usually, some sort of combination happens, so it can be for example partially scattered. How much of it is reflected, how much of it transmitted through, how much is scattered or absorbed varies based on the molecular composition of the material. As you remember, colors we see are EM radiation on certain wavelengths, as depicted in the Figure 2. EM radiation consisting of different wavelengths, encountering the same material, results in different combinations of these possibilities for different wavelengths. Therefore, if the incoming EM radiation on visual wavelengths would be “white” – consisting of equal amounts on the wavelengths of different colors, the reflected radiation would have differences. If our imaginary reflector would reflect mostly blue and red wavelengths, absorb on the green one, we would see the object as purple (combination of blue and red). In principle, this is the reason we see different colors on the surface of the sea in the images presented – within the spatial resolution cell grid of the instrument (a pixel in the figure 1) there is a mix of different materials, which return light in a combination of different intensities in the different wavelengths. For the visual wavelengths, our eyes and brain then interpret the mix with the color we understand seeing.
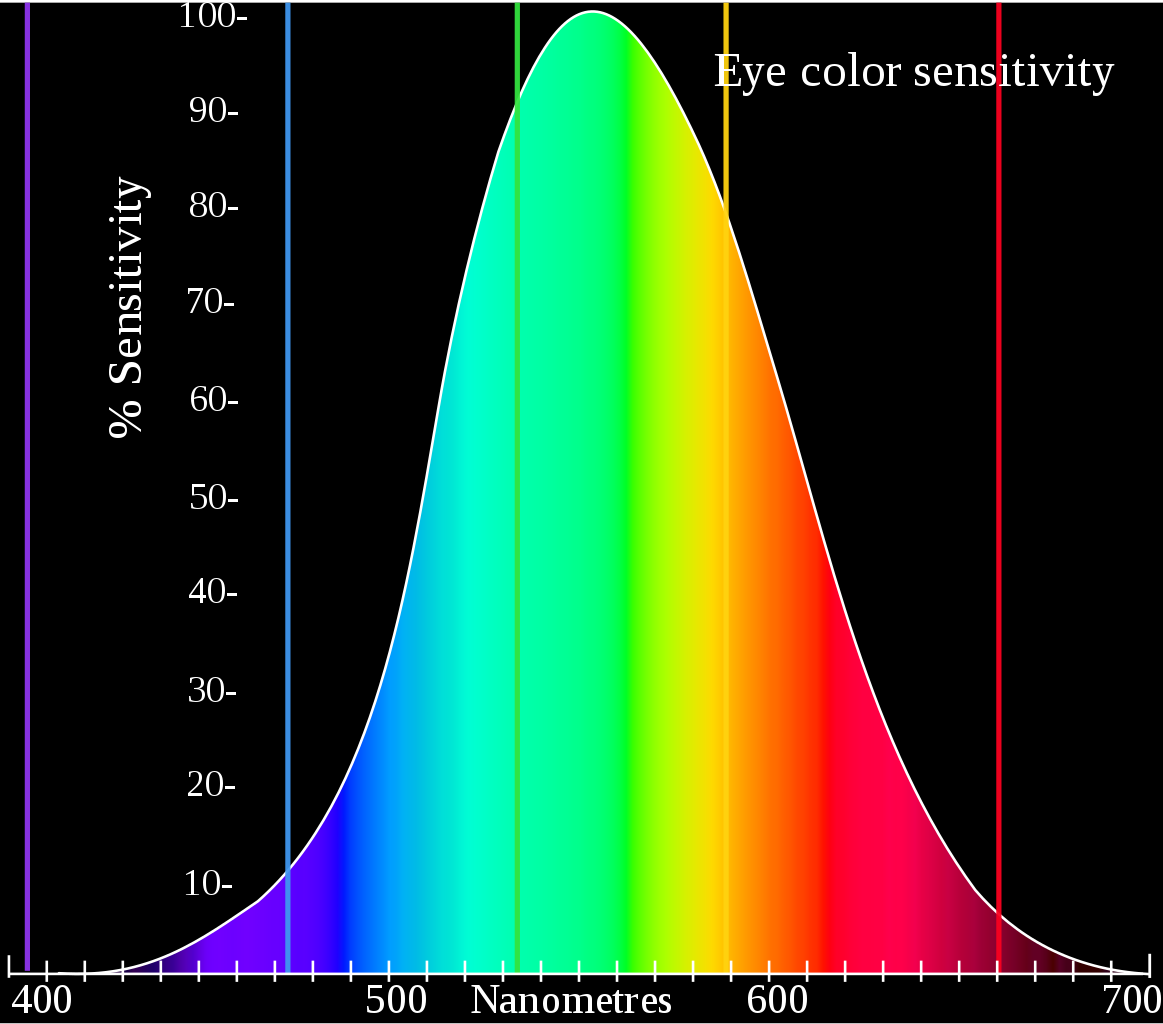
Figure 2. Human visible wavelengths and colors. Image credits: “By Skatebiker, vector by Adam Rędzikowski - File:Evesensitivity.svg, vectorised, CC BY-SA 3.0, https://commons.wikimedia.org/w/index.php?curid=24492291”. Click to enlarge.
However, when we are talking about remote sensing of the oceans there are several other factors involved besides the interaction of the EM radiation and the observed matter. When we are using satellite based optical remote sensing, the EM radiation arrives from the sun and interacts with atmospheric molecules and gases, exact results depending on the molecules and the wavelength. Some wavelengths can get absorbed almost completely but on the visible wavelengths most of the radiation generally passes through the atmosphere. After the contact with surface of the ocean, the EM radiation has to pass through the atmosphere for the second time, and depending on the molecular composition of the atmosphere, it is again scattered and absorped. Figure 3 illustrates this. In the figure Lw (green) is the water leaving radiance. That is the part of the EM radiation that “carries” information about the water and the matter within it. That is the part of radiation where different wavelengths have been diminished by the interactions particular to that wavelength and to the type of the matter in the water.
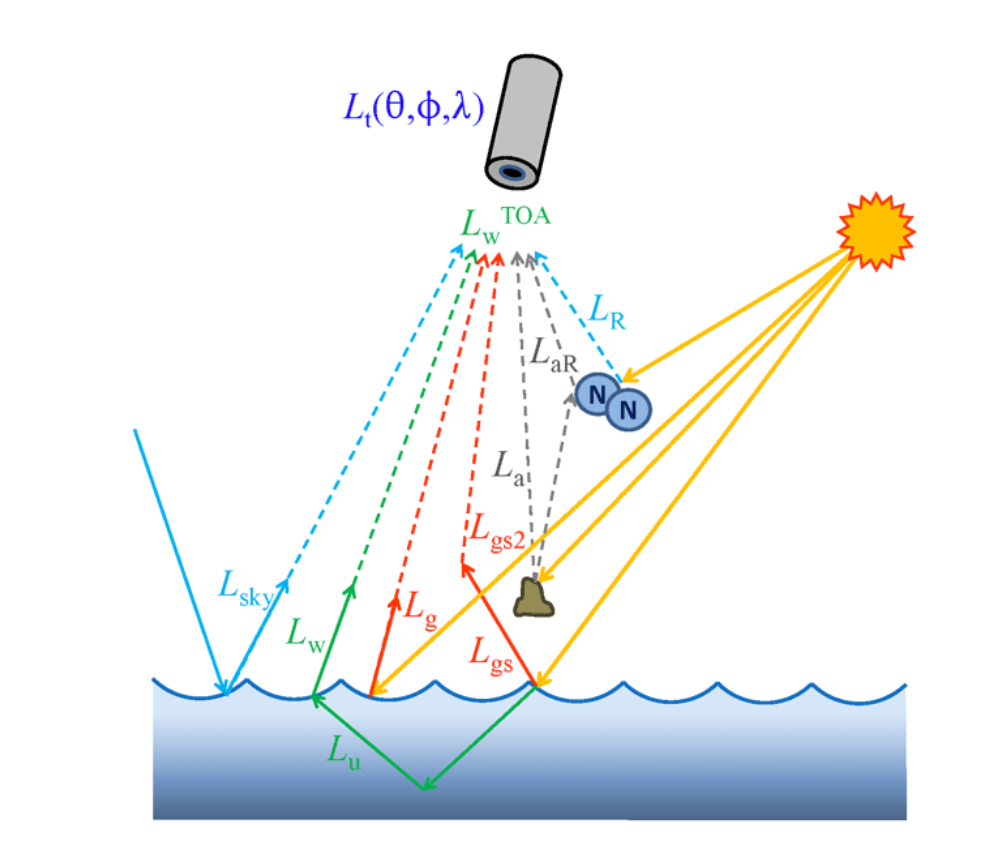
Figure 3. Different paths of light ending in the observing sensor. N-N represents a molecule in the atmosphere, brown blob represents an aerosol particle. Image credit: Ocean Optics Book. Click to enlarge.
Compared to the EM radiation arriving to the sensor via atmospheric path – not interacting with the contents of water, the radiance exiting the sea is quite small, usually approximately around 10%. It is also good to remember that the image above is simplified – some of the radiation exiting the water will be scattered by atmospheric gasses and other combinations for the depicted arrows will also occur. As pure water in relatively calm conditions is not a great reflector of EM radiation, in the remote sensing of water bodies accurate atmospheric corrections are especially important. Sensors sensitivity is additionally important, noise level – that is the part of the observations that has no relation to the examined process; for example background radiation – should be as small as possible compared to the actual measurements related to the observed phenomena. No instrument is perfect, but in these cases where the part of the signal we are interested in is in itself just a small part of the observation, sensitivity of the instrument can be an issue.
If we imagine that we have a very good atmospheric correction algorithm utilizing knowledge of the composition of the atmosphere at the time of the observation, aware of the temperature and the winds at the time of the observation, and have accurate information of the Sun and it’s relation to the viewing angle of the instrument, and we end up getting the Lw separated accurately enough. What does it consist of? Firstly, as we discussed the interaction of EM radiation with matter, the key variables are the wavelength of the EM radiation and the properties of the matter in relation to that, especially the size of the particles. Therefore different wavelengths of the visible EM radiation penetrate the water to different depths, if the water is considered homogenetic. This is illustrated in the Figure 4. It also highlights approximately how in coastal waters, where there are usually more different particles in the water, the penetration of light is more shallow.

Figure 4. Illustration of approximated light penetration on different wavelengths and in different waters. Source: Hansen, Fitzpatrick, Herring & Van Haverbeke: Heavy Oil Detection, 2009. Click to enlarge.
Besides the penetration of light, in the large, deep oceans many things are different compared to coastal waters and relatively shallow and confined Baltic Sea. Seas and oceans are dynamic. Wind, temperature differences and major ocean currents create changes in the ocean environments, which are of different scale when compared to the dynamics in Baltics. In the narrow and restricted Baltic, majority of the dynamics of the environment is driven by the nutrients and soil coming from the river systems flowing in to the Baltic and the salt water pulses through the Kattegat straights. Human activities such as farming or other activities contribute to the flow off, for example in the case of farming washed off nutrients from the fields entering water systems, collecting in the rivers and ending up in the Baltic Sea. These different kind of particles scatter and absorb incoming EM radiation. Additionally, in Baltic Sea and in the oceans there exists dissolved organic matter, which is a collection and a mixture of varied carbon based molecules, originating both in the sea and outside of it. In the shallow or coastal waters additional reflectance that further complicates interpretation of the incoming spectral irradiance in the instrument, is the possibility of reflections from the bottom of the water on some wavelengths. This is illustrated in the Figure 5.

Figure 5. Complexity of remote sensing in shallow water areas. Please note the color of the arrows, depicting different wavelength areas of the visible light. Image source: Corson & Davis: HICO Science Mission Overview. Click to enlarge.
As stated above, we can have a mix of different things in the water. As different kind of matter, consisting on different mix of molecules, react differently to incoming EM radiation on different wavelengths it is possible to draw conclusions on what is there in the water based the spectral response measured in the sensor of the satellite. The complexity of combinations of the possible interactions to occur, demonstrated in the previous figures, makes accurate analysis possible only when we have accurate knowledge of the atmospheric, weather and hydrological conditions, good enough algorithms to correct for those and most importantly, on-site measurements to verify interpretations and to calibrate the remotely sensed data.
In the Figure 6 is depicted how a few different classes of things we might encounter in the water reflect. Not only there are complex combination possibilities with the EM radiation outside the sea, there are complex combination possibilities within the water itself, depending on the mix of things in the large areas which we have as the smallest unit of observation. On the top of the Figure 6 the colors of the visible light are displayed matching their wavelength. Y-axis is the Remote Sensing Reflectance (Rrs) – Ocean Color, where the wavelength, incident angle, absorption and scattering effects and the situational radiance properties have been taken into account. Exact value is not important here, just the ratios of different classes and across the wavelengths. Sediment refers to different types of soil (dirt) suspended in the water, result of runoff from the land. CDOM is short for Colored Dissolved Organic Material, meaning organic material that reacts to light that is dissolved in the water. It is usually a combination of particles from many sources. How we can interpret the chart is that if we have pure water, we would see it as blue. Pure chlorphyll-a, it would be seen as green with the hint of blue. Sediments we would see as orange-brownish (combination of green, yellow, orange, red) and CDOM as blueish-green. Most often, the water has all of these in mixed quantities and that results in the variety of colors of the sea surfaces that was visible in the images we presented.
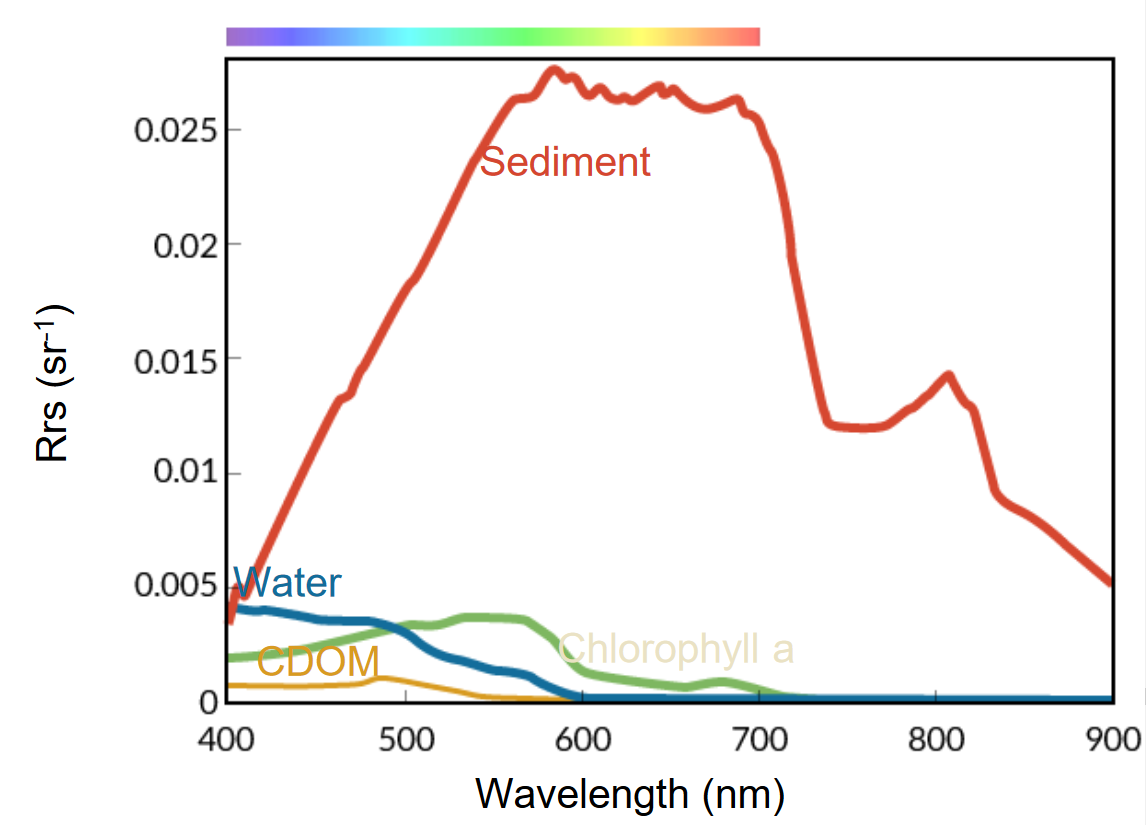
Figure 6. Remote Sensing Reflectance of most important classes. Image source: NASA Arset Training. Click to enlarge.
Qualitative interpretation of these interactions is relatively straightforward, with the current operational atmospheric correction algorithms constantly developed and refined for example by European Space Agency (ESA). With these, anyone can look at a satellite image and make some rough interpretations of the mix of different things under one observed pixel based on the spectral response there. The complexity grows enormously, when we want to make quantitative interpretations of what exactly is there, and what are the exact amounts of it. In Finland, Suomen Ympäristökeskus (SYKE) has been conducting research on water quality matters, including remote sensing, and has been providing different publicly accessible data sources to deliver the data, estimations and forecasts in this domain. Perhaps the most accessible ones are the different map-based services they have available here. In addition to these, SYKE publishes datasets and data products via API and other services.
TARKKA service is their service most related to our discussion. It allows anyone to easily view true color images from Sentinel-2 Multispectral Instrument (MSI), Sentinel-3 Ocean and Land Colour Imager (OLCI) and Landsat-8 Operational Land Imager (OLI). In addition to the true color RGB images, TARKKA service publishes remotely sensed quantative estimations of for example sediment amounts, water surface temperatures and as presented in figure 7, estimation of probability of algae. Figure 7 is from June 21st 2021, left depicting the true color image composite and on the right the probability of sea surface algae growths – blue noting areas where there is none, pearly white areas where algae is possible to exist, orange areas where surface algae growths are probable and red where they are certain. As the estimations are based on optical instruments mentioned, you can see grey areas where the sea surface is hidden by clouds. Additional interesting limitation are the grey areas close to landmasses. There the depth of the sea or the various contaminants from the ground are such that algae estimation is not presented. However, the principles that we discussed in this Kvarken Space Conversation are the same that SYKE uses to produce the estimations.
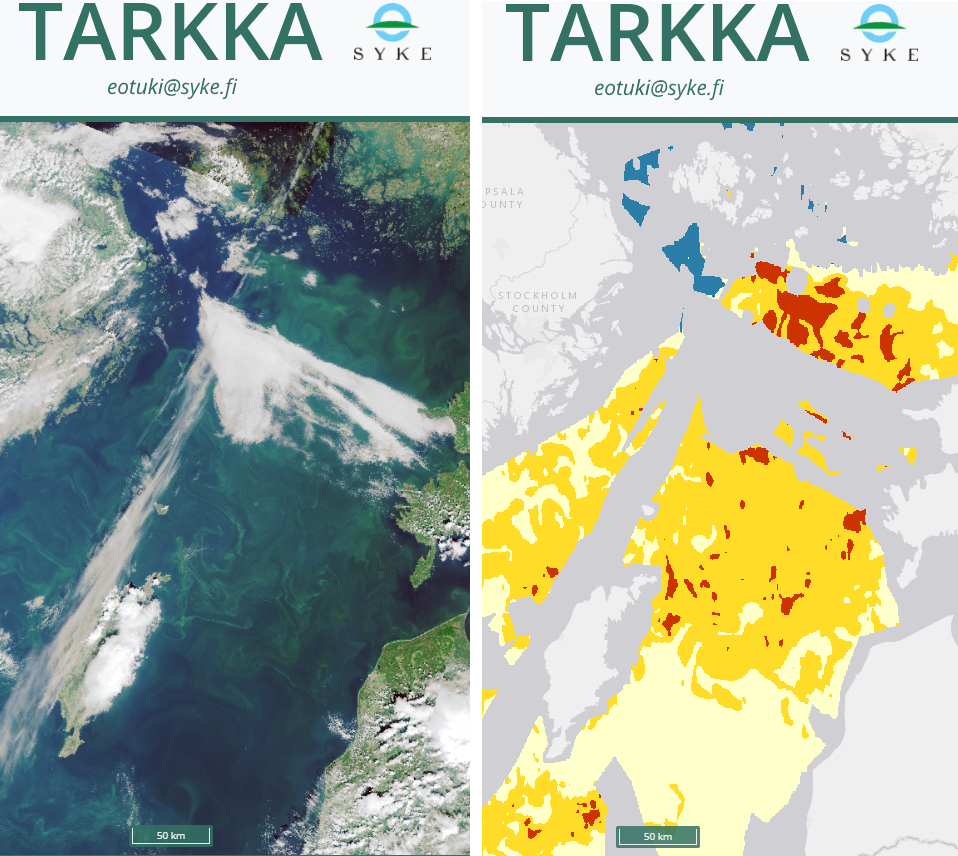
Figure 7. RGB and algae probability estimations from TARKKA service of SYKE. Image credit: SYKE. Click to enlarge.