InSAR and its applications
Over the past two decades, capabilities of synthetic aperture radar interferometry (InSAR) have been demonstrated to detect and quantify land surface deformations with millimeter-precision. InSAR relies on estimating phase shift between signals transmitted and received by satellites or aircrafts. If we send two signals toward a given object on the ground, for example a building, and receive the reflected signals at two different times (signals SAR1 and SAR2 at times t1 and t2), we can then compare the phases between two received signals (see Figure 1). If the building is stable, we will have the same phases, otherwise we will have a phase shift between the two signals that is corresponding to building displacement along the line-of-sight (LOS) of the satellite.
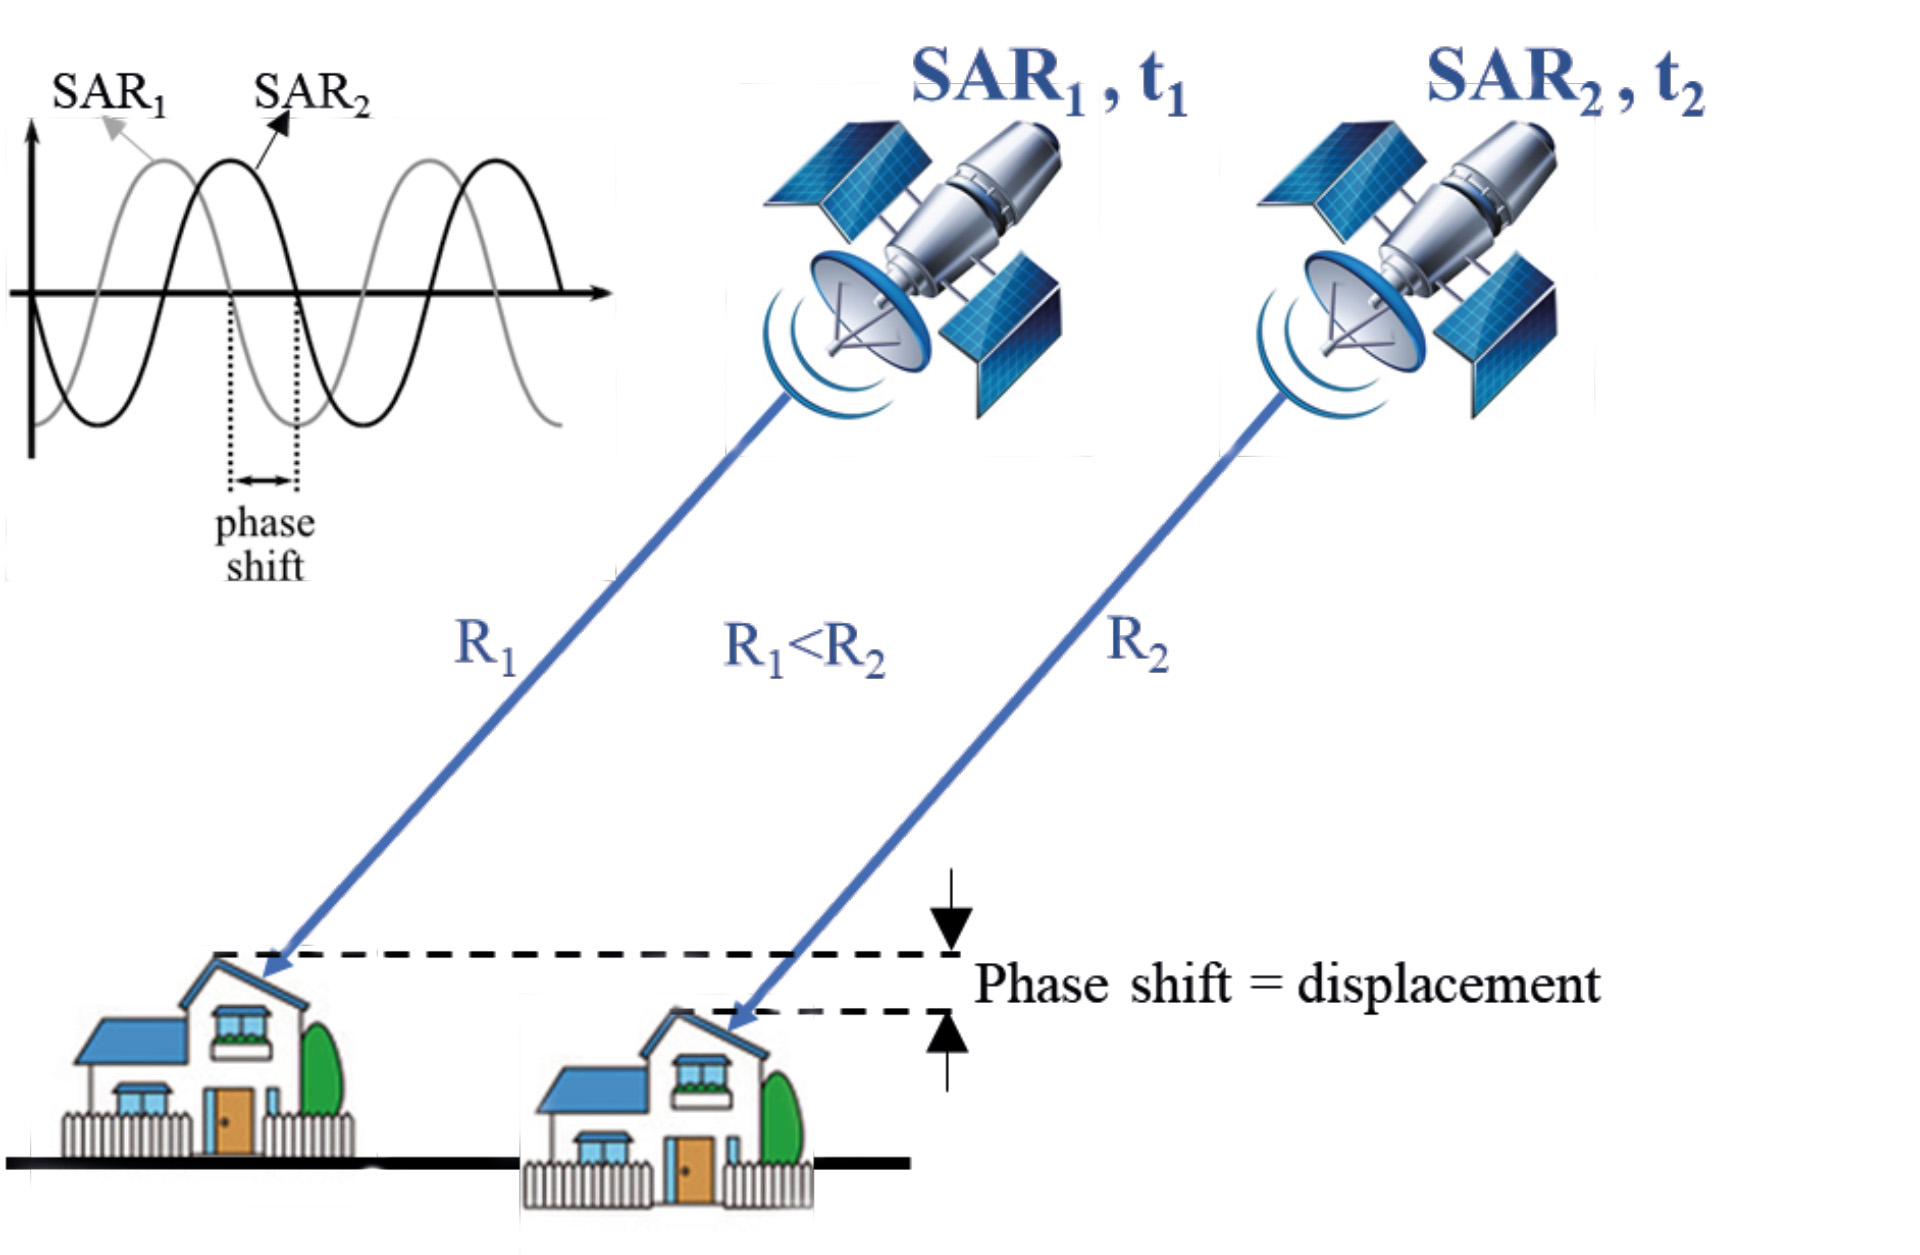
Figure 1. The building displacement on the line-of-sight direction can be estimated by calculating the phase shift between two received signals.
This InSAR principal can be used to detect ground surface motion, e.g., created by earthquakes, volcanos and land subsidence. We can also build up a system based on InSAR as a geohazard warning system to constantly monitor Earth surface movements at large scale. InSAR-Sweden is a service that generates a point deformation map for the entire Sweden using data from the European Sentinel-1 satellites. InSAR-Sweden has a web-GIS portal that provides more than 10 billion measurements obtained by InSAR technique for the time period from 2015 to 2020.
In the following, we will explain the application of InSAR for urban monitoring and present how we can use the InSAR-Sweden service and interpret and analyze an InSAR deformation map. In the first example we will investigate the urban land subsidence with focus on the public transport infrastructure (i.e., railways) in the city of Gothenburg (Figure 2), and in the second example we will see how mining activity nearby the city of Kiruna cause land subsidence (Figure 3). There are two separate photos in Figure 2.
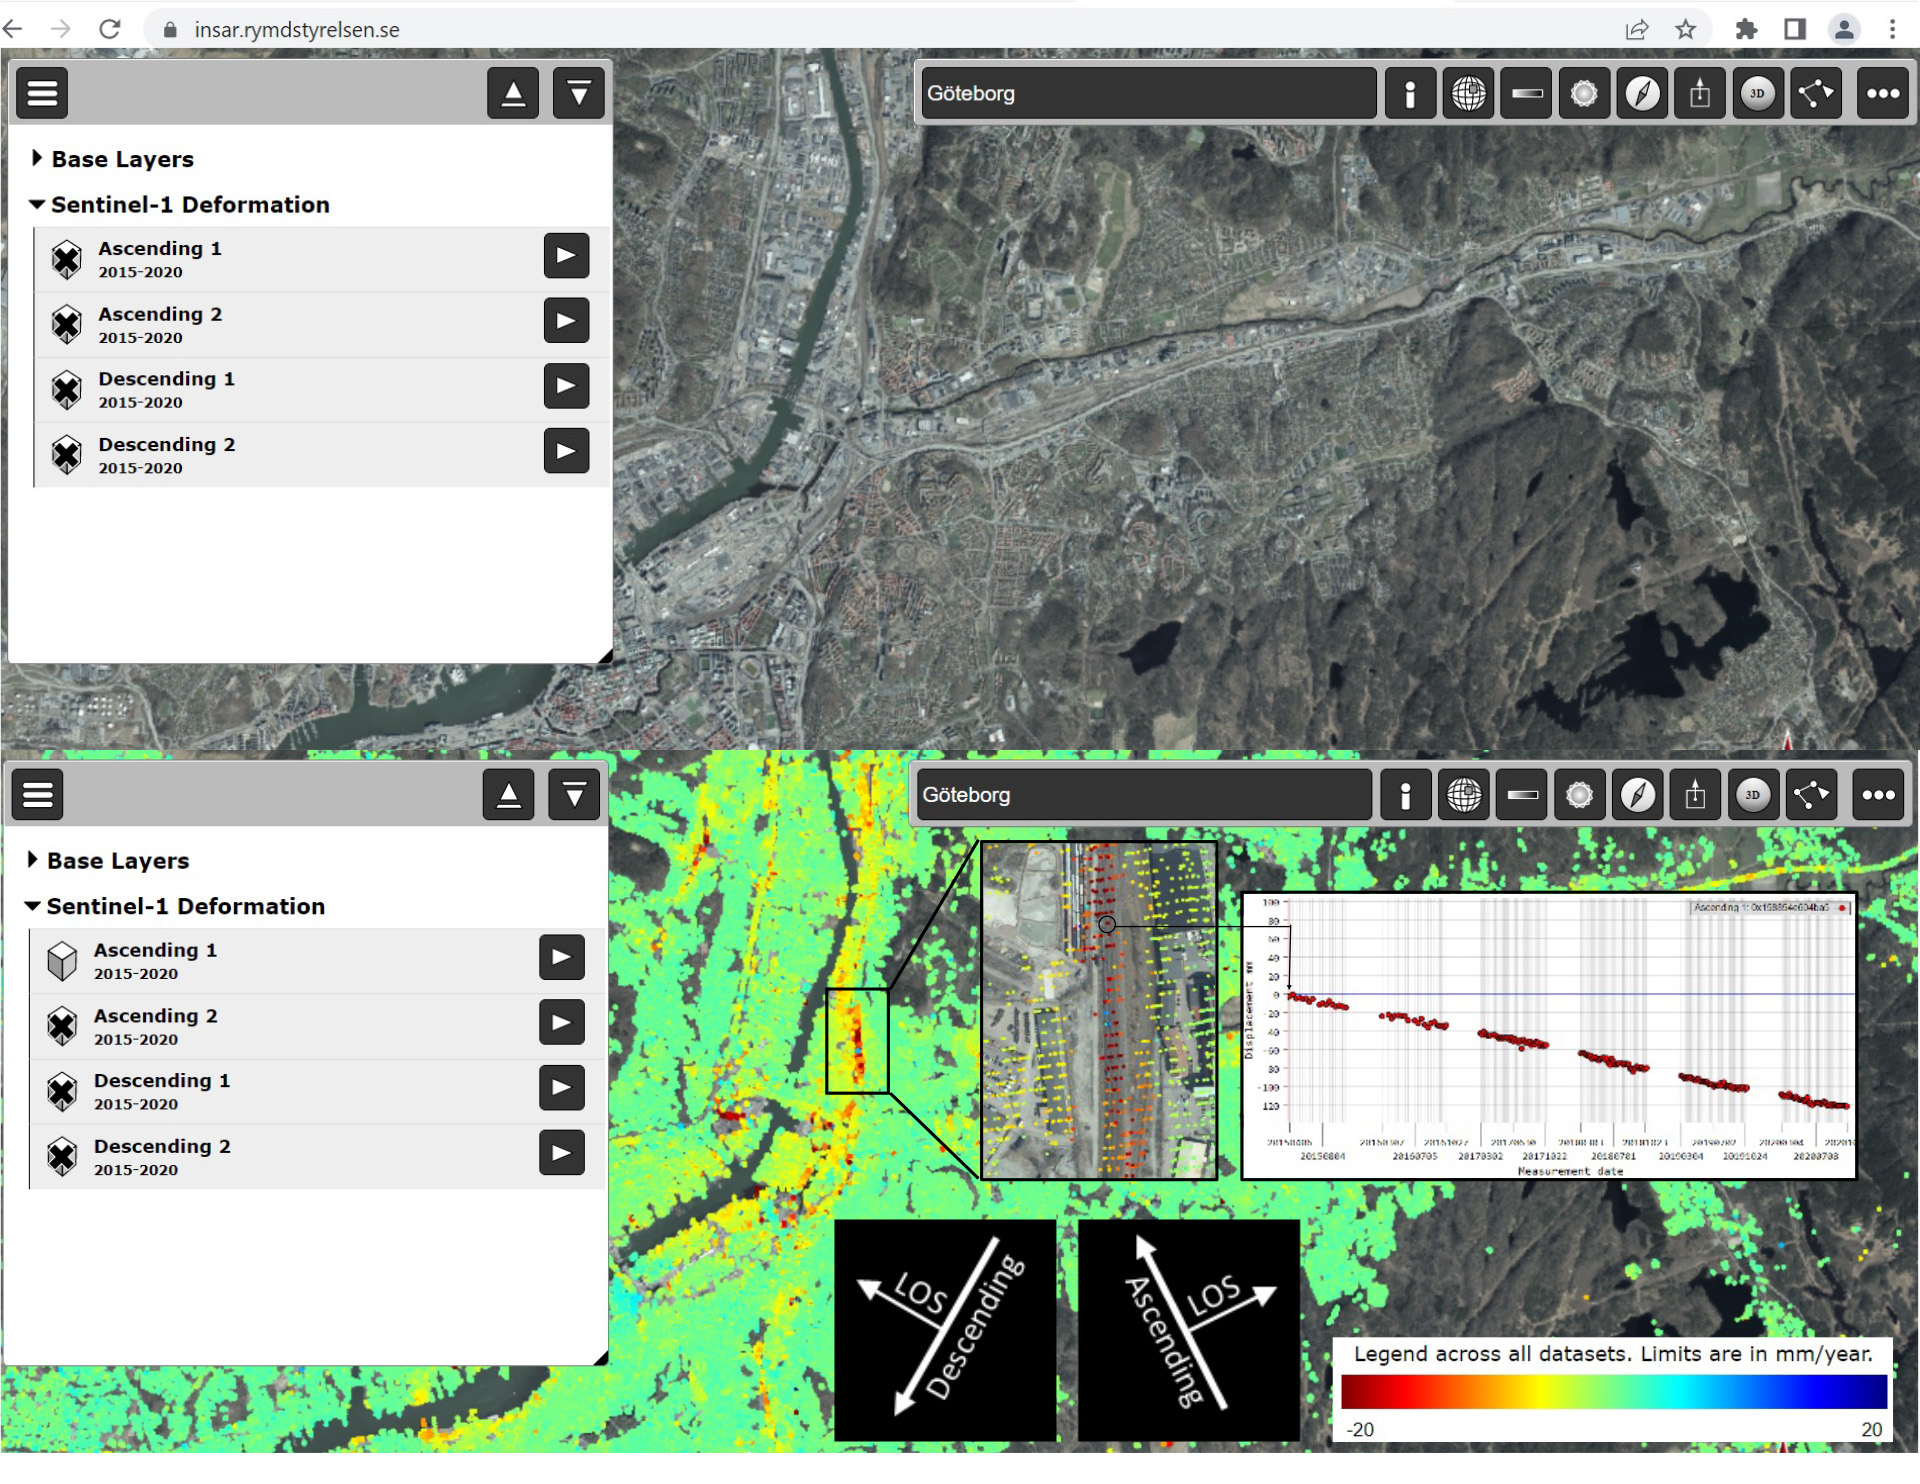
Figure 2. InSAR-Sweden service and InSAR-deformation map of Gothenburg city. A view of the InSAR-Sweden web portal is presented on the top and the InSAR-deformation map overlayed on the base map on the bottom. Four Sentinel-1 deformation maps exist in the layers box on the left and a time-series of displacement information for each point is generated by clicking on the desired point. As an example, the time-series of a point on the rail has been calculated from the ascending layer no. 1. The satellite path for ascending and descending orbits and the satellite look direction (line-of-sight) is depicted on the legend
At the top we have the view of the InSAR-Sweden webpage, with its web address visible in the address bar. Next to the search box we find service info, map legend and the possibility to share the link of the current map view. In the white box on the left, we have the base layer (background map) and Sentinel-1 deformation, including four layers of deformation maps, where each layer is related to a satellite path that can be turned on and off. Two ascending and two descending imaging radar modes exist and the difference between them is related to the difference in incident angel, view-looking (i.e., right-to-left and left-to-right looking of LOS arrows directions in Figures 2 and 3) and path of the satellite. If a deformation layer (here Ascending 1) is selected, a colorful deformation map will be overlayed on the base layer, as in the lower past of Figure 2.
The color bar indicates the movement velocity (mm/year) for each point on the map along the line-of-sight direction for the period of 2015–2020. The negative values (corresponding to yellow, orange and red colors) and positive values (corresponding to cyan, blue and dark blue colors) represent an increase and decrease in the distance between satellite and ground, respectively, and the green color shows the stable areas. As we can see on the map, a clear land subsidence pattern is observable over the city center mainly along the rails next to the Göta Älv river. A small area related to the railway was selected (the small black rectangle) and the zoomed view of the selected region is presented on the right-hand side. The dark red points along the rail show an intense subsidence. If we click on one of the red points (here in the small black circle), a new plot pops out and the displacement over time is displayed for the chosen point. The plot reveals that in five years this point has moved more than 120 mm (away from the satellite in the line-of-sight direction).
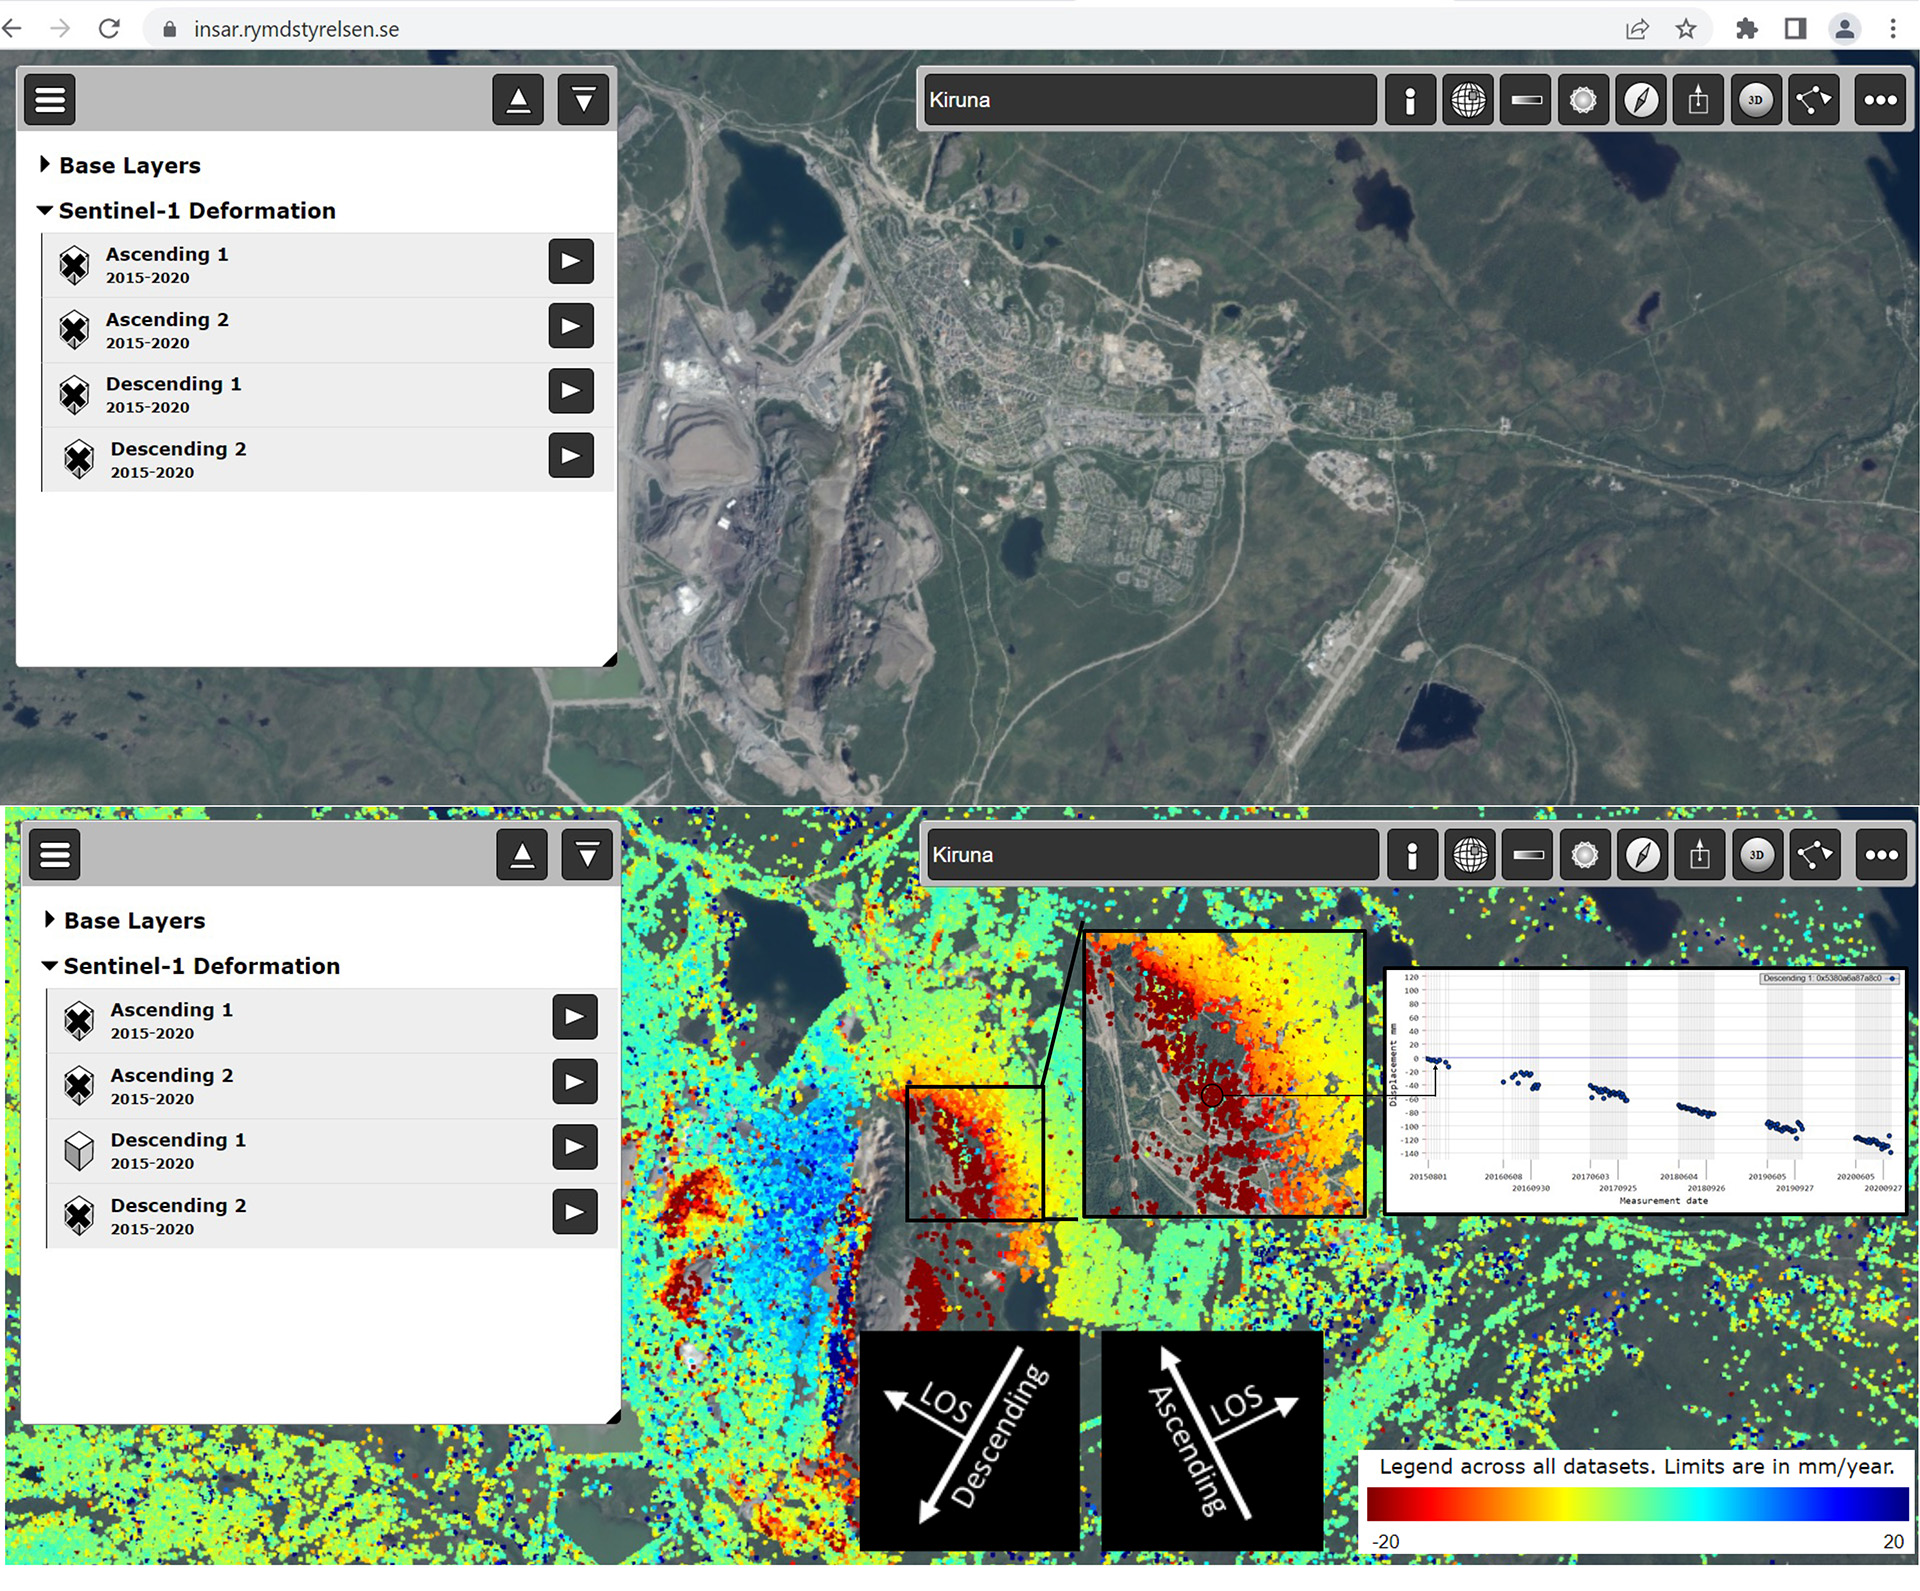
Figure 3. InSAR-Sweden service and InSAR-deformation map of Kiruna city. Time-series of displacements is displayed for a point from the urban area (black square).
In the second example, we have a similar map for the city of Kiruna (Figure 3), but the Descending 1 layer has been turned on here. The selected area is a part of the city where the ground is highly affected by the mining activity. We can see that this part of the city has the negative values starting from yellow to dark red colors in the black squares, representing that the city is subsiding. The distance between the satellite and ground has increased due to the land subsidence and that is why we have negative values here. The time-series of displacement for the selected point shows that the total movement of the point is nearly 140 mm in five years along the line-of-sight of the descending mode.
InSAR products increase productivity in geohazards monitoring, especially in the urban infrastructures sector, through provision of sustainable solutions. For example, a remote transport monitoring system based on InSAR is a powerful tool enabling us to detect structural deficiencies, anticipate the occurrence of failures and prevent accidents and optimize maintenance expenditures to undertake predictive asset management. In summary, InSAR provides a reliable, fast, accessible, user-friendly early-warning system to support decision-making processes and risk management.
Mehdi Darvishi and Leif E.B. Eriksson
Division of Geoscience and Remote Sensing,
Department of Space, Earth and Environment,
Chalmers University of Technology, Gothenburg, Sweden
Johan E.S. Fransson
Department of Forest Resource Management,
Swedish University of Agricultural Sciences, Umeå, Sweden,
Department of Forestry and Wood Technology,
Linnaeus University, Växjö, Sweden
The content of this article was produced by the InSAR Sweden project, which is funded by the Swedish National Space Agency and the Swedish Transport Administration. Sentinel-1 data were provided by the European Union's Earth observation programme Copernicus and were downloaded free of charge from the Copernicus Open Access Hub.