A wavelength at the shore
We touched the topic of electro-magnetic radiation in our earlier discussion (link here). The waves actually forming the electro-magnetic radiation could be simplified and visualized as waves of water hitting a beach of a lake or the sea. In truth, electromagnetic radiation does behave in some occasions in other ways, but we will leave that out for now.
If you reach with your hand to these waves at the shore, you feel them pushing your hand. That is actually the waves transferring their movement energy against your hand. How strongly you feel the water pushing your hand depends on the speed and height of the wave. Additionally, you see how the waves hitting the beach reflect back to the sea. Imagine that there’s a floating piece of wood right at the shore line. These reflections of the water back are easy to see from it’s bobbing.
Actually, if you’d draw on a paper the bobbing of the wood during a coming wave, you would get something interesting. If you have a piece of paper and a pen, you can do this at home, or with any drawing program with a computer, or with just imagination. We would start drawing from the left edge of the paper, in the middle height wise. The middle of the paper height marks the completely still water. You can draw a straight line across the paper in the middle. First dot goes there. The floating piece of wood is not moving, it’s there in still water, and the first dot in the middle of the paper, near the left edge of the paper. Wave starts to come in, the wood rises a bit. Time has passed, so the second dot goes to the right of first one, but as the wood is higher now in the water, the dot on the paper is higher as well. The following dots behave the same, as the wood keeps raising in the incoming wave, so does the positions of the dots on the paper. And always, the same amount of time has passed, so these dots are always similar distance to the right of the previous one.

Image 1. Click to enlarge
Finally, at the highest peak of the wave, the wood is at it’s highest. Your image would look something like Image 1 this when you connect the dots. The height of the wave is called amplitude, the distance from the still level of water to the highest peak. If you continue the same process now that the wave is starting to shrink and the piece of wood is getting lower, the dots just keep going down. The dots reach the middle line, the level of still water and still keep going down, as after the wave the piece of wood keeps going lower and lower. As the lowest peak has been reached, the wave is starting to pass the piece of wood and it starts raising. When it reaches back to the level of still water, the wave has passed.
Image 2. Click to enlarge.
How to compare these waves and talk about them? If you and your friend talk about waves you both separately saw, how would you describe them to each other? You already know the amplitude, wavelength is another thing of interest. The wavelength is defined as the distance from the start of the wave to the end of the wave and the preciding image 2 would be quite similar to what you would have drawn. Speed of the waves in water can change, but when we consider invisible waves of electromagnetic radiation, the speed of the waves is fixed, it’s the speed of light. Shorter and longer wavelengths can be visualized as in the following image 3.
Image 3. Click to enlarge.
One other way to describe the waves is the frequency. With frequency we mean how many waves hit the shore in certain fixed time. To allow comparison of measurements and to understand measurements done by others, there has been a standard developed, Hertz. Hertz tells us how many waves happen in one second - one Hertz means that one wave comes through in one second.
If we have invisible wave, an electromagnetic wave, that has one meter from the bottom of the wave to the bottom of the next wave, what is it’s frequency? Can we calculate it with this information? Well, yes and no. We need to know it’s speed, but we talked about it earlier. Speed of the electromagnetic radiation waves is always the speed of light, approximately 300 000 000 m/s (300 000 km/s). To know how many waves of this wavelength of 1 meter goes through in one second, we divide the speed of light with 1 meter. Result is 300 000 000 Hz or 300 MHz. 300 million waves happens in one second, waves of electromagnetic radiation are really fast!
Electromagnetic radiation is all that is available for the sensors orbiting the earth to observe different things happening in Earth. Similarly to the bobbing of the piece wood in the shore to the reflected waves from the shore, these instruments in space react to the electromagnetic radiation reflected from earth on different wavelengths.
Image 4. Click to enlarge.
This week we showed you an image from the Sentinel-2 MSI instrument (Image 4), which records amounts of electromagnetic radiation reflected from Earth in 13 different wavelengths. For each wavelength, the MSI instrument records how much of it was reflected back. Wavelengths it observes are quite short, they are mostly easily referred to in nanometers. 1 nanometer is just 0, 000 000 001 meters and thus the frequencies are very high. Frequency related to 1 nanometer is 300 PHz. Electromagnetic radiation in the area that we can see, we call just light, and it covers the area from 380 nm to 750nm. Here in the image 5 the areas MSI instrument measures are overlayed with the spectrum of electromagnetic radiation. You can also see in which areas of the spectrum the bands we used are. These are false color images, and if you’d like to remind you what these were, you can take a look at our previous discussion (link here).
Image 5. Click to enlarge.
Why does the MSI-sensor record so many radiation intensities in different wavelengths? Objects and things reflect and absorb the electromagnetic radiation in various wavelengths distinctly. Even so distinctly, that is possible to create a wavelength profile for a certain type of thing, which tells you how well the type of thing reflects radiation in these different wavelengths, and then use this profile to identify these things in other pictures! We’ll get in to more detail with that in the future, but with this image 6 below, you can observe the differences yourself. Reflections in different wavelengths really do tell different stories!
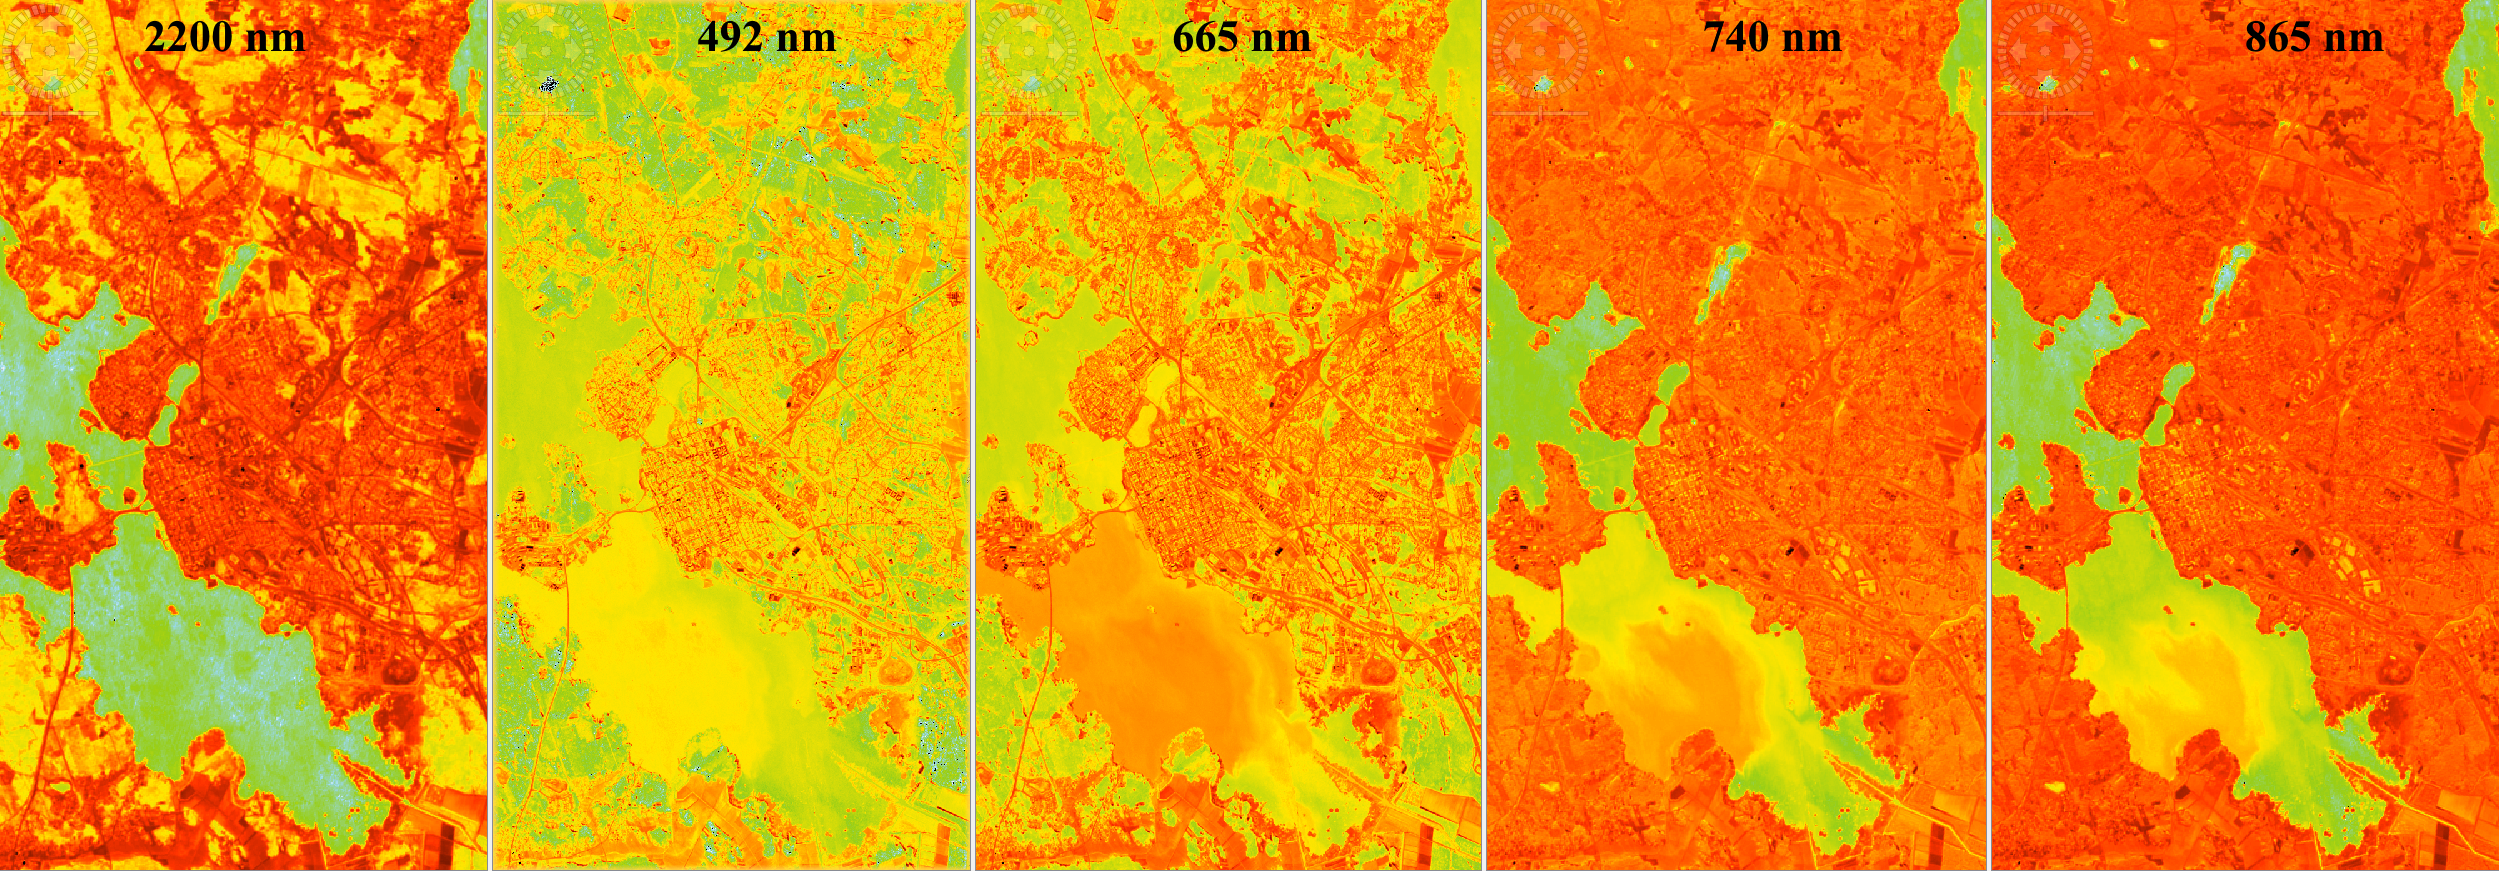
Image 6. Click to enlarge.